Sleep efficiency matters because it turns a vague question, "Did I sleep well?" into a usable ratio. If you use a wearable, you have probably seen the number already. The catch is that sleep efficiency can clarify your sleep pattern or mislead you, depending on how you interpret it.
Key takeaways
1. Use 85%+ as a practical benchmark, not a nightly pass or fail test.
2. Interpret it alongside total sleep time. The CDC states that adults should get at least 7 hours of sleep.
3. Look at 7 to 14 day averages, not one night.
If you are searching for what is a good sleep efficiency, the short answer is that around 85% or higher is commonly considered good or normal in adults. That still needs context. A high score is not especially helpful if your total sleep time is too short, and a low score can reflect extra awake time in bed rather than a deeper sleep problem.
This article explains the benchmark ranges that are actually useful, how the formula works, how wearables estimate the number, what tends to lower it, and how to tell whether the issue is time in bed, trouble falling asleep, or repeated awakenings. It also shows where this fits into recovery, stress regulation, metabolism, and screening for sleep-disordered breathing.
Where sleep efficiency fits in the bigger picture
Sleep efficiency sits inside recovery first. It tells you how continuous your sleep is, not just how long you stayed in bed. That matters for people trying to stay sharp, train consistently, manage stress, and avoid turning minor sleep disruption into a monthly pattern.
It also overlaps with mind and arousal state. Stress, rumination, and hypervigilance often show up as longer sleep onset latency, more wake after sleep onset, or both. Metabolism matters too because alcohol and late eating can fragment sleep even when bedtime looks consistent. Heart health enters the picture because loud snoring, witnessed pauses in breathing, morning headaches, or excessive daytime sleepiness can point toward sleep apnea, which can reduce sleep continuity and deserves proper evaluation.
That is why sleep efficiency works best as one benchmark inside a broader recovery view, not as a standalone score to chase. If you want a wider context, the Sleep & Recovery overview shows how continuity, duration, and daytime readiness fit together.
Quick answer
A good sleep efficiency is typically 85% or higher in adults, a threshold commonly used as a benchmark in sleep medicine. Many healthy adults often fall in roughly the 85% to 95% range, and a meta-analysis of healthy adults found mean sleep efficiency values above 90% through midlife, with lower averages in older groups on polysomnography data across healthy adult age ranges. Two caveats matter more than the number itself: high efficiency can still mean you are not getting enough total sleep time, and consumer wearables can miss wake time, especially quiet wakefulness when compared with polysomnography.
- Use 85%+ as a practical benchmark, not a nightly pass or fail test.
- Interpret it alongside total sleep time. The CDC states that adults should get at least 7 hours of sleep.
- Look at 7 to 14 day averages, not one night.
- If efficiency is low, ask whether the main issue is long sleep onset latency, more wake after sleep onset, or too much awake time in bed.
If you want to make this practical, track last night's sleep and compare it with your 7-day average in the huuman app so a single rough night does not drive your decisions.
Sleep efficiency: definition, formula, and the terms that matter
Sleep efficiency is a ratio: the amount of time you were actually asleep divided by the amount of time you spent in bed, multiplied by 100. In simple form, that is total sleep time divided by time in bed, times 100.
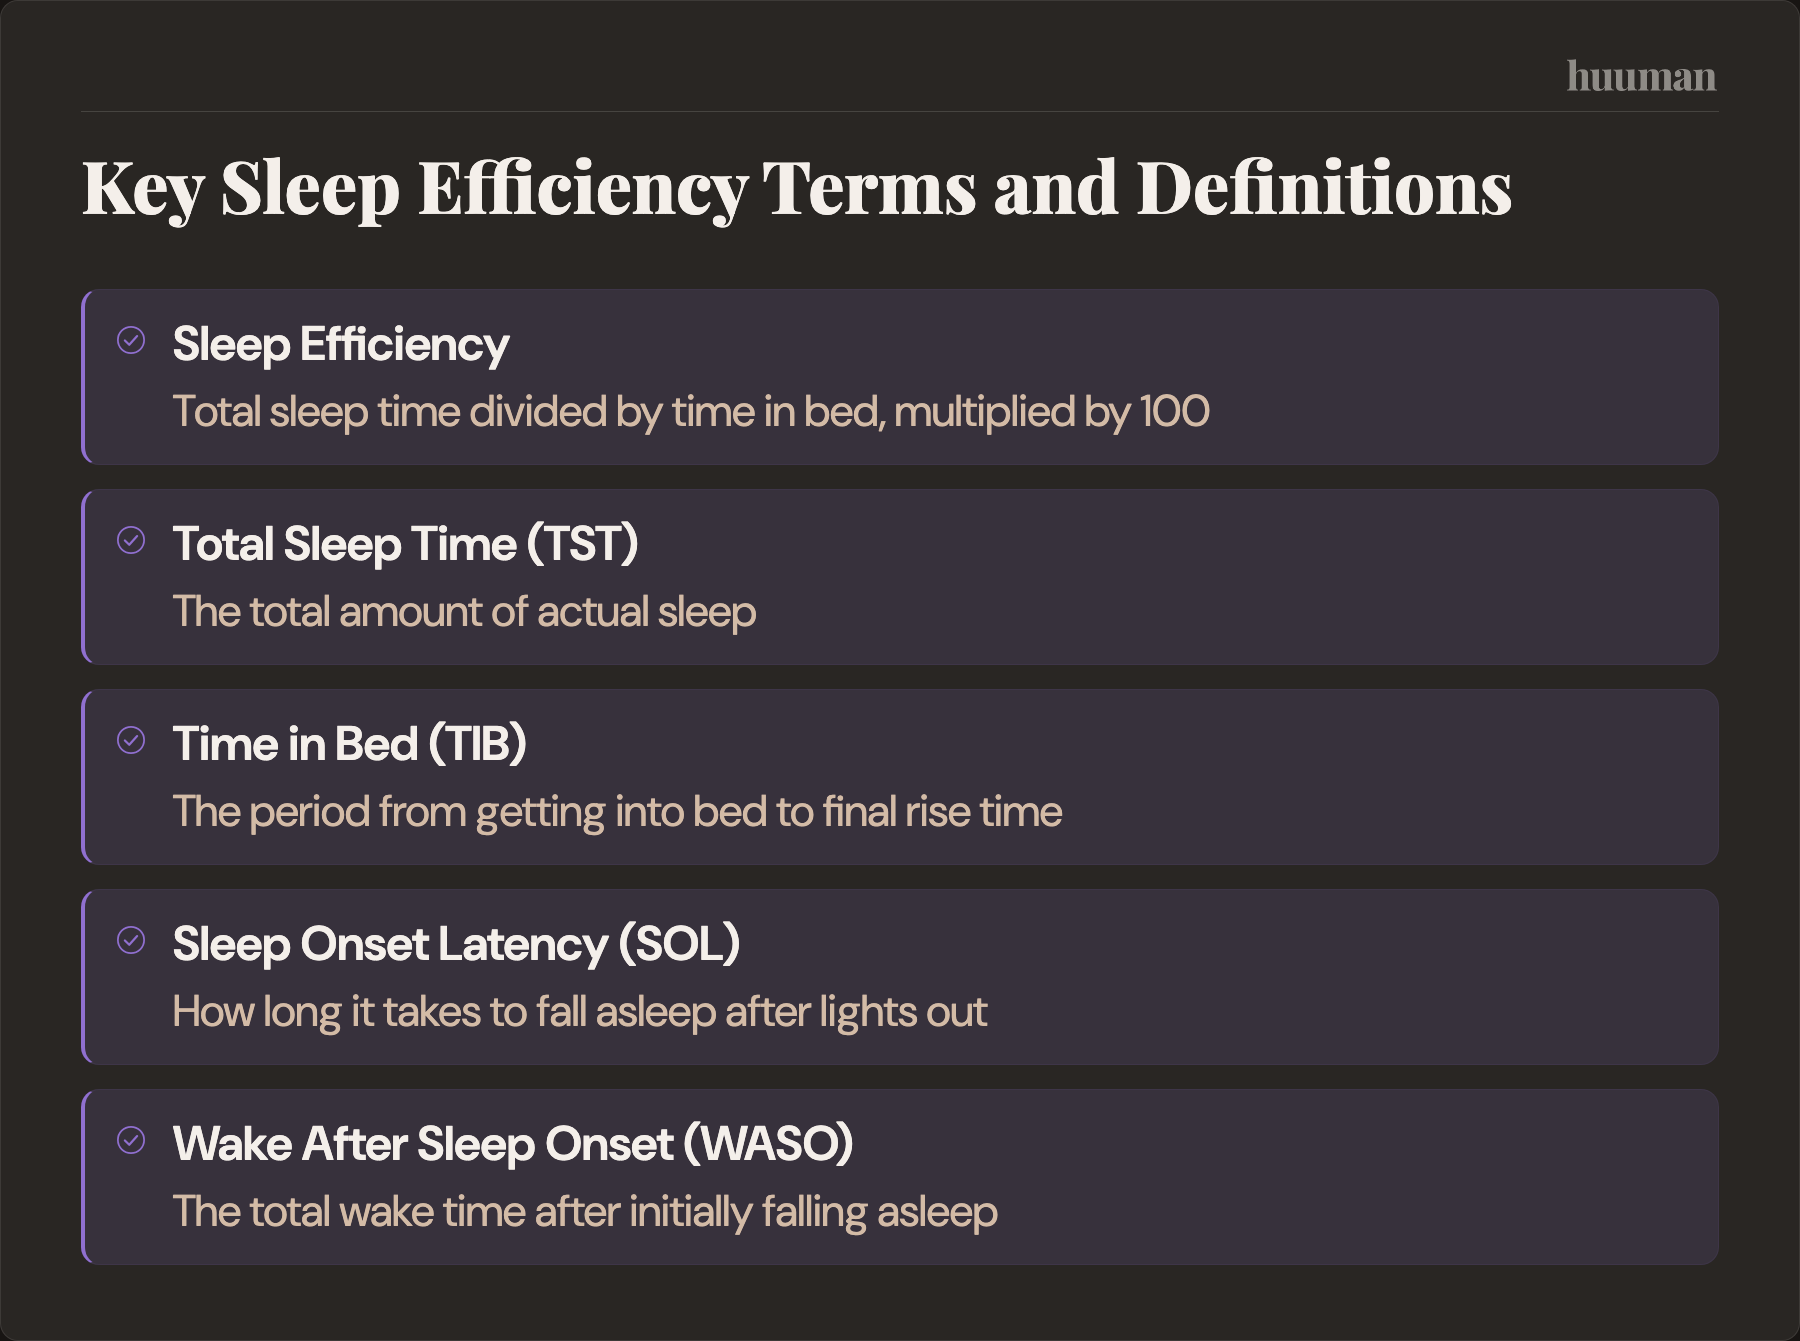
- Total sleep time, TST: the total amount of actual sleep.
- Time in bed, TIB: the period from getting into bed to final rise time, though some systems define it differently.
- Sleep onset latency, SOL: how long it takes to fall asleep after lights out.
- Wake after sleep onset, WASO: the total wake time after initially falling asleep.
- Awakenings: the number and pattern of wake-ups during the night.
The denominator is where confusion starts. Some trackers use time in bed from when you lie down. Others try to estimate "sleep opportunity" based on when you intended to sleep, or effectively from "lights out." If you read in bed for 30 minutes, one app may count that as time in bed and another may try to exclude some of it. That is one reason the same person can see different sleep efficiency values across devices.
Worked example
If you slept for 7 hours and spent 8 hours in bed, your sleep efficiency is 87.5%.
- Time asleep: 7 hours
- Time in bed: 8 hours
- Calculation: 7 ÷ 8 × 100 = 87.5%
Mini calculator
Use this simple rule: divide total sleep time by time in bed, then multiply by 100.
- Example 1: 6.5 hours asleep, 8 hours in bed = 81.25%
- Example 2: 7.5 hours asleep, 8 hours in bed = 93.75%
- Example 3: 6 hours asleep, 6.5 hours in bed = 92.3%
The third example is why context matters. That is a high efficiency score, but it may still be too little sleep for many adults.
What counts as a good sleep efficiency in real life
If your goal is a usable benchmark for what is a good sleep efficiency, start with this: 85% or higher is commonly considered good or normal. Beyond that, the number needs interpretation.

- Below 85%: commonly used as a sign that more awake time is occurring in bed than expected. It is a prompt to check context, not a diagnosis.
- 85% to 90%: broadly consistent with a solid range for many adults.
- Above 90%: often seen in healthy sleepers, especially younger adults, but not automatically "better" if total sleep time is short.
Research on normal polysomnography values suggests that mean sleep efficiency tends to be higher in younger adults and decreases with age. Many healthy younger and middle-aged adults often show values above 90%, while older adults may have lower averages without that necessarily indicating a clinical problem.
What matters more than chasing a perfect number is matching the score to your situation:
- If sleep efficiency is high but total sleep time is under 7 hours, the likely issue is not continuity. It may be a short sleep window.
- If time in bed is very long, sleep efficiency can fall simply because you are awake in bed more often.
- If your schedule is disrupted by travel, caregiving, shift-like work, illness, or pain, expect more variability.
Benchmark table
- 85% or higher: commonly considered good or normal. First check whether total sleep time is also adequate.
- Around 90% and above: often seen in healthy adults, especially younger groups. Make sure it is not coming from a compressed sleep window.
- Below the mid-80s repeatedly: worth looking at sleep onset latency, wake after sleep onset, alcohol, stress, environment, and possible sleep disorder clues.
Sleep stages matter, but for this keyword they are secondary. A wearable can tell you about light, deep, and REM sleep, and those can be useful trend signals. But if sleep continuity is poor, stage breakdown usually does not explain much until you understand whether the issue is falling asleep, staying asleep, or simply spending too much awake time in bed. If you want to separate continuity from staging, see deep sleep and overall sleep efficiency and what a perfect sleep score looks like.
How wearables calculate sleep efficiency and why your number may differ from how you feel
Polysomnography, or PSG, is the reference standard in sleep labs because it measures brain activity, eye movements, muscle activity, airflow, breathing effort, oxygen levels, and more. Actigraphy, often used in research and clinical tracking outside the lab, estimates sleep mainly from movement patterns over time. Consumer wearables such as Oura, WHOOP, and Fitbit typically combine motion with heart rate and other signals, then use proprietary algorithms to estimate sleep and wake.
The practical implication is simple: these tools are useful for trend tracking, but they are not interchangeable with PSG. Reviews of wearable sleep technology show that consumer devices often overestimate total sleep time and underestimate wake time, and a more recent systematic review found varying accuracy across popular consumer wearables when compared with polysomnography.
That matters because sleep efficiency depends heavily on correctly detecting wake time. If your device misses quiet wakefulness, your efficiency may look better than the night felt. If it wrongly includes reading or scrolling in bed as time in bed, your efficiency may look worse.
Common reasons a wearable can misread efficiency
- Motionless wakefulness: lying still while awake may be scored as sleep.
- Reading or scrolling in bed: this stretches time in bed and can depress efficiency even if actual sleep was fine.
- Partner, child, or pet movement: noisy bed environments can distort estimates.
- Sensor placement and fit: loose or inconsistent wear changes data quality.
- Travel or unusual routines: algorithms handle regular patterns better than irregular schedules.
So if your wearable says your sleep efficiency was "great" but you felt alert at 3 a.m. for a long stretch, trust the discrepancy as useful information. It means you should compare the score with subjective sleep quality, daytime sleepiness, and whatever your device reports for SOL and WASO rather than taking the efficiency score at face value.
The two main ways sleep efficiency drops
Most low sleep efficiency patterns come from one of two buckets.

1. Longer sleep onset latency
This is the "I went to bed but I did not fall asleep" pattern. Causes often include stress, rumination, late screen stimulation, caffeine too late in the day, intense evening training for sensitive people, travel, heat, light, or simply going to bed before enough sleep pressure has built up.
In data terms, TIB rises while TST does not rise in parallel. The ratio drops.
2. More wake after sleep onset
This is the "I fall asleep fine but wake up repeatedly" pattern. Common disruptors include alcohol, large late meals, reflux, pain, nasal congestion, noise, room temperature, medications, illness, nocturia, stress-related awakenings, and disorders such as sleep apnea or restless legs and periodic limb movement disorder.
Two people can have the same sleep efficiency score with very different patterns. One may spend 45 minutes trying to fall asleep and then sleep through the rest of the night. Another may fall asleep quickly but have frequent awakenings. The decision point is different, so efficiency alone is not enough.
Evidence and limits
Sleep efficiency is a legitimate sleep medicine metric, and it is also used in treatment contexts such as cognitive behavioral therapy for insomnia, or CBT-I. A systematic examination of CBT-I trials found that sleep restriction therapy protocols commonly use sleep efficiency targets in the 85% to 90% range. That supports the idea that mid-to-high 80s are clinically meaningful as benchmarks.
Still, sleep efficiency is not itself a diagnosis. A low value does not mean insomnia. A high value does not guarantee restorative sleep. The number is only as good as the definition behind it and the method used to measure it.
One important limitation is the denominator problem. "Time in bed" sounds straightforward, but in practice different systems define the sleep window differently. Some use lights out to final wake time. Some use get-in-bed to get-out-of-bed. Some estimate sleep opportunity. That changes the percentage even when the night itself did not change. This is one reason comparisons between apps, and especially between an app and a sleep lab, need caution.
Another limitation is that consumer wearables are better at estimating sleep than wake. For sleep efficiency, that creates a simple bias risk: if wake time is missed, efficiency rises on paper. That is why trends matter more than single values and why low efficiency needs context from symptoms, function, and pattern.
Non-prescriptive strategies to discuss with a professional
For busy adults, the most useful approach is not to "optimize sleep" in ten directions at once. It is to identify which lever is leaking minutes: too much awake time before sleep, too many exits during the night, or too little actual sleep opportunity.
A simple SLEEP framework
- S, Sleep window: compare time in bed with total sleep time. If the gap is large, check whether you are going to bed too early, lingering in bed awake, or extending mornings in bed.
- L, Latency: if falling asleep is the bottleneck, common low-risk levers include a steadier wake time, a wind-down period, reducing stimulating screen use close to bed, and avoiding clock-watching.
- E, Exits: if awakenings dominate, review alcohol, caffeine timing, meal timing, hydration timing, pain, reflux, nasal congestion, and whether the room is too warm.
- E, Environment: light, noise, temperature, and bedding are often underestimated because they feel too simple to matter. They are often high leverage.
- P, Physiology and pressure: stress load, illness, training load, travel, possible apnea, and restless legs symptoms can all lower sleep efficiency.
A minimal experiment often described in the sleep literature is to focus on a stable wake time, a real wind-down instead of extending screen time in bed, and bedroom light and temperature control for about two weeks. Not because these solve every pattern, but because they make the signal cleaner.
Training adds a personal layer. Some people sleep well after hard evening exercise, while others see more delayed sleep onset. If a pattern appears, moving intense sessions earlier can be a useful experiment. If you are trying to balance fatigue, performance, and sleep continuity, it helps to connect this with recovery duration and sleep efficiency.
For stress-driven sleep onset problems, breath pacing and similar downshift tools may help some people, though not universally. A simple example is 4-7-8 breathing to fall asleep faster. Caffeine timing can also matter more than people think, even if they "can fall asleep anyway." If you use evening calming routines, keep expectations realistic and avoid turning them into a performance test. If drinks are part of your routine, be cautious with broad claims about sleep aids such as herbal teas that improve sleep efficiency.
If snoring is loud, breathing pauses are witnessed, daytime sleepiness is significant, or leg discomfort creates an urge to move at night, move past self-experimentation and consider formal evaluation. That applies even if a wearable gives respectable-looking scores.
How to track and interpret changes
The best tracking setup is simple enough to sustain and specific enough to show what is changing. For a 14-day troubleshooting phase, track:
- Bedtime
- Lights out time
- Wake time
- Total sleep time
- Sleep efficiency
- Sleep onset latency if available
- Wake after sleep onset if available
- Alcohol that evening
- Caffeine cutoff time
- Training timing
- Stress rating
- One line on environment or symptoms, such as heat, congestion, pain, reflux, travel, or snoring
14-day sleep efficiency audit checklist
- Daily: record bedtime, lights out, wake time, TST, efficiency, alcohol, caffeine cutoff, and whether training was early, late, or absent.
- If your device provides it: add SOL and WASO so you can distinguish difficulty falling asleep from broken sleep.
- Every 7 days: review rolling averages for efficiency and total sleep time together.
- Decision rule: if efficiency is low but total sleep time is also low, first ask whether your sleep window is simply too short.
- Decision rule: if efficiency is low with long SOL, look at pre-bed arousal and schedule friction.
- Decision rule: if efficiency is low with high WASO, focus on fragmentation triggers and possible screening flags.
- Meaningful change: look for a stable direction over 2 to 4 weeks rather than reacting to one off night.
The real win is not a prettier graph. It is identifying the limiting factor. Efficiency can hide whether the problem is latency, exits, or not enough time devoted to sleep. Once you know that, your next step gets narrower and more intelligent.
If you want that pattern to be easier to see, your huuman Coach can help interpret sleep trends, recovery signals, and weekly patterns so you can spot whether SOL, WASO, or a short sleep window is driving the metric.
Signal vs noise
- Sleep efficiency is useful, but it can look great when you are undersleeping. Check total sleep time first and compare it with the general adult need for at least 7 hours.
- A single bad night is noise; repeated low efficiency is signal. Review a 7 to 14 day average before changing routines.
- Wearables can mislabel quiet wakefulness as sleep. If the score looks better than the night felt, trust the mismatch enough to inspect SOL, WASO, and daytime sleepiness.
- Reading or scrolling in bed inflates time in bed and depresses efficiency. Separate wind-down from actual lights out for a cleaner denominator.
- Alcohol can speed sleep onset while fragmenting sleep later.
- Stress can increase awakenings even if total time in bed is unchanged. Track a simple stress score and watch whether low-efficiency nights cluster around high-arousal days.
- Temperature and light are high-leverage variables many people underestimate. Run one week with deliberate bedroom cooling and light control before assuming the issue is more complex.
- Snoring plus low efficiency is a reason to think beyond sleep hygiene. If there are witnessed pauses, gasping, morning headaches, or marked sleepiness, consider formal evaluation.
- A very high score is not always a win. If you are exhausted, going to bed late, and sleeping solidly for too few hours, the metric may simply reflect a compressed sleep window.
- Comparing apps can create false alarms. Stick with one device and one method long enough to make trend comparisons meaningful.
When to consult a professional
Consider professional help if low sleep efficiency shows up with loud habitual snoring, witnessed breathing pauses, gasping, excessive daytime sleepiness, drowsy driving, insomnia symptoms most nights for weeks with daytime impairment, morning headaches, new nocturia, restless legs symptoms, or mental health and substance use issues affecting sleep. These are screening pointers, not diagnoses, but they are strong reasons not to rely on sleep scores alone.
Sleep metrics also connect with other recovery signals. If you are trying to make sense of changes across the whole picture, it can help to compare sleep with what your HRV says about recovery, HRV as a sleep quality marker, resting heart rate and sleep quality, and monitoring heart rate while you sleep. For parents, age-specific sleep benchmarks are a different topic entirely, so use resources on how much sleep babies need or sleep needs for toddlers rather than applying adult efficiency expectations to children.
If you want to turn a 14-day audit into a clearer plan, use the huuman app to log sleep, recovery, and check-ins in one place so you can see whether the limiting factor is latency, wake after sleep onset, or an overly short sleep window.
Common questions
What is a healthy sleep efficiency score?
A healthy sleep efficiency score is commonly described as 85% or higher. Many healthy adults, especially younger and middle-aged groups, may often sit above 90% in sleep lab data. The useful question is not only "Is the score high?" but "Is it high alongside enough total sleep time and decent daytime function?"
Is 94% sleep efficiency good?
Usually, yes. A value like 94% is generally consistent with strong sleep continuity. But it is only good news if you also slept long enough. Six hours of sleep in a short sleep window can still produce a high efficiency score while leaving you under-slept.
What is normal sleep efficiency by age?
Average sleep efficiency tends to be higher in younger adults and lower in older adults. The meta-analysis cited above found lower mean values in adults over 60 than in younger age groups. That means age can shift expectations, but broad age trends are not a personal diagnosis tool.
How do you calculate sleep efficiency?
Divide total sleep time by time in bed, then multiply by 100. If you slept 7 hours and spent 8 hours in bed, your sleep efficiency is 87.5%.
What does low sleep efficiency mean if I still get 7 to 8 hours in bed?
It usually means a larger share of that time was spent awake. The awake time may be happening before sleep starts, after awakenings during the night, or because you are spending extra time in bed before lights out or after waking. That is why SOL and WASO are more useful than the efficiency percentage alone.
Can my wearable overestimate sleep efficiency?
Yes. Consumer wearables often estimate sleep better than wake, especially when you are lying still. That can lead to overestimated total sleep time and underestimated wake time, which pushes sleep efficiency upward on paper compared with PSG.
What is the 10-5-3-2-1 rule, and does it improve sleep efficiency?
It is a popular rule of thumb that spaces out stimulants, food, work, screens, and bedtime. It can help some people reduce pre-bed friction, but it is not a proven universal formula for raising sleep efficiency. Treat it as a structure for experimentation, not a guarantee. If your issue is frequent awakenings from snoring, reflux, pain, or a sleep disorder, the rule may not address the main problem.
More health topics to explore
- Sleep & Recovery – Overview
- Sleep Music: How to Choose the Right Sound for Faster, Deeper Sleep
- Running Recovery: A Practical, Evidence-Aware Playbook for Runners
- Deep Sleep Pillow Spray: What It Is, Whether It Works, and How to Choose Safely
References
- CDC — Adults Sleep Facts and Stats
- de Zambotti M et al. — Wearable Sleep Technology in Clinical and Research Settings (2019)
- Reed DL & Sacco WP — Measuring Sleep Efficiency: What Should the Denominator Be? (2016)
- Kyle SD et al. — Towards standardisation and improved understanding of sleep restriction thera... (2015)
- Cappuccio FP et al. — Sleep duration and all-cause mortality: a systematic review and meta-analysis... (2010)
- Schyvens AM et al. — Accuracy of Fitbit Charge 4, Garmin Vivosmart 4, and WHOOP Versus Polysomnogr... (2024)
- Liu Y et al. — Prevalence of Healthy Sleep Duration among Adults--United States, 2014 (2016)
- Arnedt JT et al. — Sleep following alcohol intoxication in healthy, young adults: effects of sex... (2011)
- Haghayegh S et al. — Accuracy of Wristband Fitbit Models in Assessing Sleep: Systematic Review and... (2019)