The calories burned during strength training often look contradictory online: everything from "barely relevant" to "extremely high." The reason is simple, strength training isn't a uniform activity. Two sessions of the same length can differ significantly in energy expenditure depending on exercises, rest periods, and training density.
What matters more than a single number is a realistic range and understanding what actually shifts that number. That lets you set better expectations, interpret wearable data properly, and decide whether to adjust training or nutrition.
Key takeaways
1. For many people, 1 hour of strength training falls in the range of a few hundred calories; dense sessions (circuits, supersets) can go higher.
2. The biggest lever is training density: how much actual work you do versus how much time you spend resting.
3. Compound movements (squats, deadlifts, rows, pull-ups, bench press) drive more total demand than isolation exercises.
Below, you'll find evidence-based ranges for 30, 45, and 60 minutes, the main drivers, a grounded take on the afterburn effect, and practical guidelines for interpreting smartwatch calorie data.
What "calories burned" really means in strength training
Calories (kcal) and kilojoules (kJ) describe energy expenditure. In real life, these are estimates, not exact measurements. Many tables and calculators rely on the MET concept (Metabolic Equivalent of Task), which converts activities into standardized intensity levels and factors in body weight and time.
In strength training, this model runs into real-world complexity: long rest periods, highly variable intensity, and technique-driven movements. That's why MET-based numbers are useful for establishing a range, but not precise, session-level predictions.
For context and planning, it helps to understand the basics. In our hub Metabolism, Nutrition & Energy – Overview, you can see how resting and active energy expenditure interact, and why training is only one piece of the puzzle.
Quick answer
- For many people, 1 hour of strength training falls in the range of a few hundred calories; dense sessions (circuits, supersets) can go higher.
- The biggest lever is training density: how much actual work you do versus how much time you spend resting.
- Compound movements (squats, deadlifts, rows, pull-ups, bench press) drive more total demand than isolation exercises.
- Wearables are often off for strength training. Use them for trends, not absolute calorie counts.
- Best approach: work with ranges, track progress via volume, body composition, and consistency, and plan nutrition separately.
Want to see how your actual training sessions compare to these estimates? You can log your strength sessions with RPE and rest times through the huuman app to build your own calorie burn patterns over time.
Why calorie burn varies so much in strength training
Work time vs. rest time dominates everything. "60 minutes in the gym" is rarely 60 minutes of work. Longer rests lower the average. Supersets or circuits increase active time and significantly raise calories per minute.
Exercise selection matters. Compound movements recruit large muscle groups and challenge the cardiovascular system more than isolation work.
Intensity, in practical terms, means proximity to muscular failure.
Body weight and surface area scale linearly: more mass requires more energy for the same task.
Training format (classic split with rest vs. full-body, circuits, or conditioning-style workouts) determines density. Training status and technique also play a role: more efficient movement can reduce energy cost at the same output.
Secondary factors like heat or stress can affect perceived effort and heart rate, but are less important overall.
Benchmarks: calories for 30 / 45 / 60 minutes
The following ranges are based on MET estimates and align with common reference tables. They provide a realistic corridor for typical gym conditions.
- Note: Estimates for ~70–80 kg body weight; scale roughly with body weight; actual values vary depending on density and exercise selection.
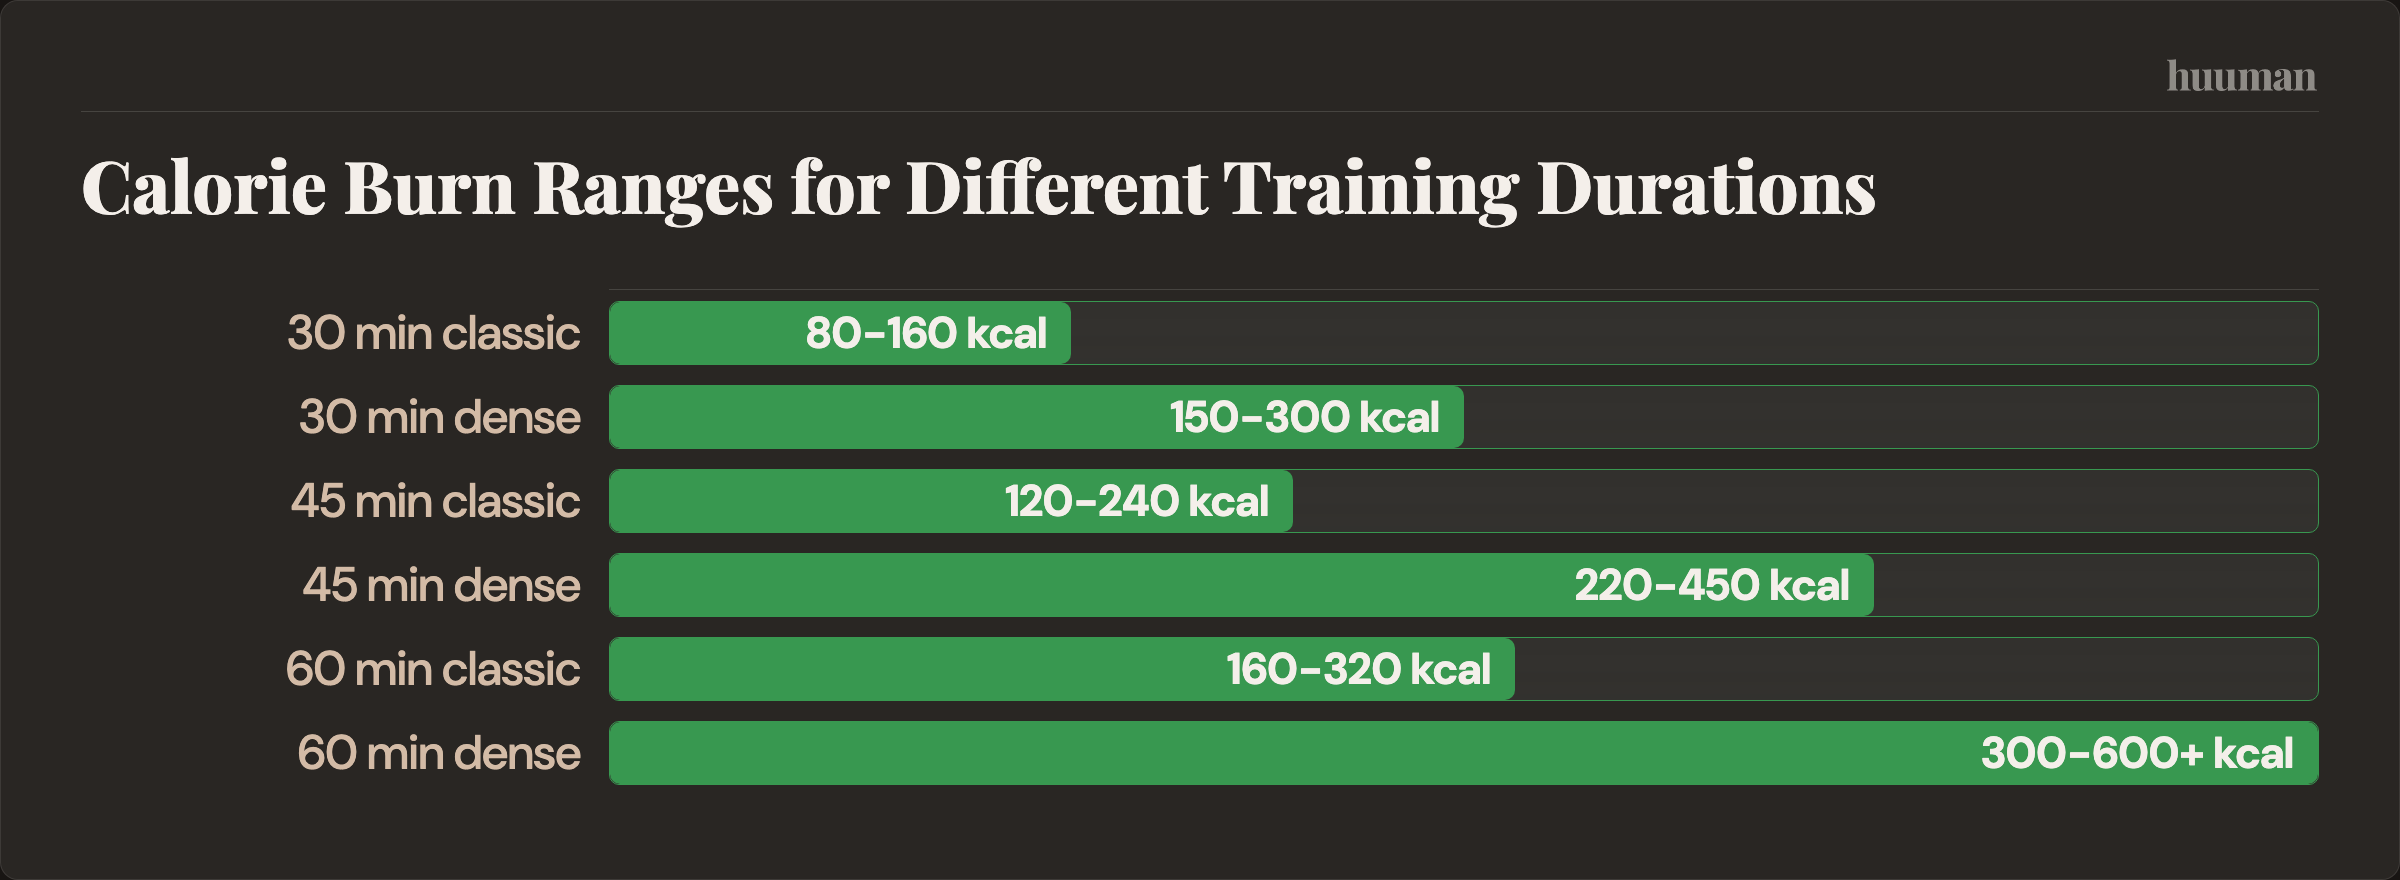
Table: strength training calorie ranges
- Duration | Classic (long rest) | Dense training (supersets/circuits) | Notes
- 30 min | ~80–160 kcal | ~150–300 kcal | Work time vs. density is key
- 45 min | ~120–240 kcal | ~220–450 kcal | Compound movements raise averages
- 60 min | ~160–320 kcal | ~300–600+ kcal | Long rest significantly lowers averages
Context: Traditional strength training often lands in the lower-to-mid range. Dense sessions with large movements can go much higher, but are also more systemically demanding.
How to scale by body weight: MET-based estimates roughly follow MET × body weight (kg) × time (hours). More weight means proportionally higher calorie burn. It's still an approximation.
MET quick check (mini calculator)
Many tables use MET values for "weight lifting, general" (moderate) and "vigorous." Without detailed session data:
- Choose an intensity level (moderate vs. vigorous).
- Use the formula: MET × kg × hours.
- Compare your result with the table above and adjust based on your training density.
Public reference tables show ranges similar to those above. For practical estimates, you can also use sources like the TK overview as a benchmark.
Main drivers (ranked)
- 1) Training density (work vs. rest)
- 2) Body weight
- 3) Exercise selection (compound over isolation)
- 4) Proximity to failure
- 5) Rest duration and structure
- 6) Training status and technique
Comparison: strength training vs. cardio
At the same duration, cardio often burns more calories because there's less downtime. But that's only part of the picture:

- Fat loss: driven by total energy balance over days. Cardio may burn more short-term calories, but strength training helps preserve muscle mass and shape body composition.
- Muscle and strength: strength training is essential – even if calorie burn is lower.
- Health: both matter. Cardio supports cardiovascular health; strength training builds structure, stability, and functionality.
The better question isn't "what burns more," but what moves you toward your goal. For a broader perspective, see Metabolic health explained.
Afterburn effect (EPOC): real, but limited
EPOC refers to elevated oxygen and energy use after training. Its magnitude depends on exercise intensity and duration, so it's larger after intense, high-density workouts with large muscle groups and smaller in lighter sessions. While some studies show EPOC can be elevated for several hours post-exercise, the overall contribution to daily energy expenditure remains modest.
The key point is magnitude: reviews suggest the effect is real but moderate and varies widely. Claims of very large, long-lasting increases should be viewed cautiously.
In practice: don't base your progress on maximizing "afterburn." Treat EPOC as a bonus that contributes a bit when conditions are right.
Smartwatches & trackers: why calorie estimates are often off
Most devices estimate energy based on heart rate models. This works better for steady-state cardio than for strength training. Reasons include:
- Isometric contractions and bracing can raise heart rate without equivalent mechanical work.
- Rest periods distort averages – brief peaks followed by inactivity.
- Stress, caffeine, and heat affect heart rate independently of actual workload.
Validation studies show wearable calorie estimates vary by context and are often less accurate for strength training.
Quick guide: interpreting smartwatch calories
- Use trends within the same type of training, not absolute numbers.
- Don't compare "leg day" to "cardio day" by calories.
- Prioritize volume and structure (sets, reps, load, density) as your main metrics.
Evidence and limitations
Most everyday estimates of calories burned during strength training come from MET tables and observational data. They're useful for ranges, not exact predictions. A commonly cited reference shows similar magnitudes Energy expenditure in sports (TK).
For EPOC, reviews confirm the effect with wide variability depending on intensity and volume. For wearables, systematic reviews also highlight measurement errors and context dependency, especially for non-steady activities like strength training.
Without lab-based indirect calorimetry, individual values remain estimates. More useful than a single number is tracking change over weeks.
Strategies to discuss with a professional
If your goal is higher energy expenditure without compromising training quality, there are two main levers, with trade-offs:
- Moderately increase density: supersets with non-competing muscle groups raise calorie burn but also fatigue.
- Increase NEAT (daily movement): extra steps are often the more reliable lever outside the gym.
- Progressive overload builds muscle as a long-term asset, while energy intake drives fat loss.
- Conservative structure: many programs include 1–2 denser sessions per week if recovery allows.
Your recovery determines how much density you can handle. Markers like HRV values and deep sleep duration provide context, even if they don't directly explain calorie burn.
How to measure and interpret progress
Instead of trying to maximize calories every session, focus on consistent, trackable signals. A quick 2–5 minute weekly check is often enough:

- Body weight as a 7-day average
- Waist circumference (practical guide: waist measurement for women)
- Strength markers in 2–3 key lifts (e.g., reps at a fixed load)
- Density proxy: total work (sets × reps × load) and session duration
Additionally, trends in your body fat percentage help show direction over time. If you read these signals well, you don't need exact calorie numbers per session.
Rather than obsessing over individual session calories, focus on the bigger picture. Your huuman Coach can build personalized weekly plans that balance strength training density with your recovery capacity, helping you optimize both performance and energy expenditure over time.
Signal vs. noise: how to interpret strength training calorie burn
- Signal: increasing density with similar fatigue. Next step: track sets, rest, and total time – not just minutes in the gym.
- Noise: one session with unusually high watch calories. Stay consistent: use weekly averages within the same training type.
- Signal: progress in compound lifts. Keep going: prioritize exercises with high muscle involvement.
- Noise: "calories per exercise." Ignore it: focus on total session structure.
- Signal: decreasing waist with stable strength. Maintain course: training and nutrition are aligned.
- Noise: exaggerated EPOC claims. Stay grounded: don't rely on afterburn.
- Signal: consistent weekly routine. Reinforce it: repeatable structure beats occasional hard efforts.
- Noise: daily weight fluctuations from water. Use averages: 7-day trends over single values.
Frequently asked questions
How many calories do you really burn in 1 hour of strength training?
Typically a few hundred calories. Longer rest sessions tend to be lower; dense formats higher. The table above provides a solid reference range.
What's realistic for 30 minutes of strength training?
Often around ~80–160 kcal for classic sessions and ~150–300 kcal for higher-density formats. Short duration amplifies the impact of rest periods.
Why does calorie burn vary so much?
Because density, exercise selection, intensity, and body weight vary widely. Two sessions of equal length can involve very different amounts of real work.
What is the afterburn effect and how big is it?
EPOC is additional energy use after training. It's higher after intense, dense workouts but generally moderate and highly individual.
Does strength training or cardio burn more calories?
During the session, cardio is often higher. For body composition, strength training remains essential because it preserves muscle. Your goal and weekly balance matter most.
Are smartwatch calorie estimates reliable?
They're useful for trends, but unreliable as exact values. Heart rate models have limitations in strength training.
Is burning 500 kcal in the gym a good workout?
It can happen, but on its own it says little about training quality. Structure, progress, and long-term changes matter more.
More health topics to explore
- Metabolism, Nutrition & Energy – Overview
- Waist Circumference in Women: Normal Ranges, Risk Thresholds & How to Measure
- When Do You Start Seeing Results from Weight Loss? A Realistic Timeline + How to Track Progress
- How to Measure Waist and Hip Circumference: WHR Calculator, Guide, and Interpretation
References
- Techniker Krankenkasse — Sport Energieverbrauch Kalorienverbrauch
- ACSM — Progression Models in Resistance Training (2009)
- Ainsworth BE et al. — 2011 Compendium of Physical Activities: a second update of codes and MET values (2011)
- Techniker Krankenkasse — Energieverbrauch beim Sport
- Børsheim E & Bahr R — Effect of exercise intensity, duration and mode on post-exercise oxygen consu... (2003)
- Boudreaux BD et al. — Validity of Wearable Activity Monitors during Cycling and Resistance Exercise (2018)
- Panissa VLG et al. — Magnitude and duration of excess of post-exercise oxygen consumption between ... (2021)
- Smolander J et al. — Heart rate and blood pressure responses to isometric exercise in young and ol... (1998)